How to use Moving Average to gain Maximum profit?

What is the Moving Average?
“Average” is a term familiar to nearly everyone, typically learned in school. So, what does “Moving” mean in this context? In the dynamic world of the stock market, where data changes rapidly, the Moving Average method ensures that we always consider the most recent information while filtering out older data. This way, traders can better understand the current trend and make more informed decisions based on the latest market conditions.
Let’s use an example to illustrate the above concept-
Let’s say the closing prices for ITC stock for the past 6 days are as follows:
Kindly look at the image on the right side.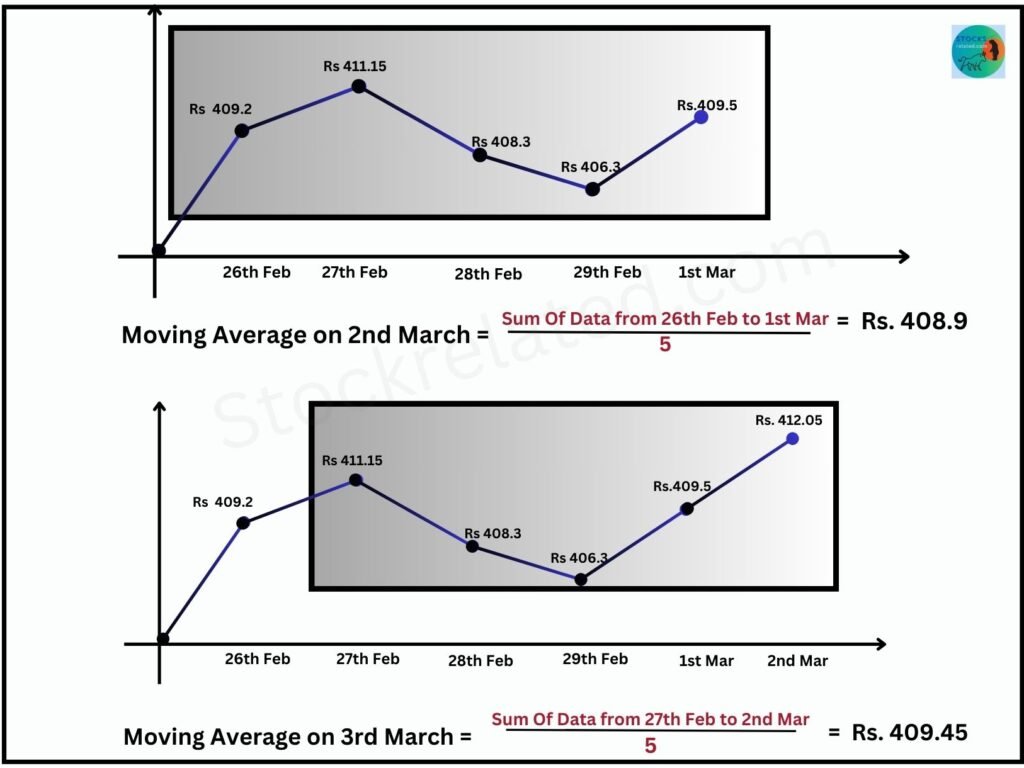
Closing data for 6 days
- 26th Feb 2024: Rs. 409.2
- 27th Feb 2024: Rs. 411.15
- 28th Feb 2024: Rs. 408.3
- 29th Feb 2024: Rs. 406.3
- 1st Mar 2024: Rs. 409.5
- 2nd Mar 2024: Rs 412.05
Calculated the 5-day Moving Average on 2nd March = Rs.408.9
Computed 5-day Moving Average here on 3rd March = Rs.409.45
You may have observed that when calculating the Moving Average on March 3, 2024, the data from February 26 was excluded, while the data from March 2 was included.
A Moving Average is a type of average calculation that incorporates the most recent data while excluding the oldest data points. This Moving average is also called the Simple Moving Average (SMA).
Types Of Moving Averages:
There are several types of Moving Averages:- Simple moving average (SMA), Exponential moving average (EMA), Double Exponential Moving Average (DEMA), Triple Exponential Moving Average (TEMA), Triangular, VIDYA, Hull, Variable, Weighted moving average, etc.
The stock market primarily relies on two types of moving averages: Simple Moving Average (SMA) and Exponential Moving Average (EMA). SMA represents the basic form of moving averages, while EMA stands for the exponential variant. Since we’ve covered SMA, let’s now explore the nuances of EMA.
EMA = (Closing Price x Smoothing Factor) + (Previous EMA x (1 – Smoothing Factor)).
The smoothing factor for a 200-day EMA is 2/(200+1) = 0.0099.
I’ve provided the formula for EMA here, but we won’t delve into it extensively, as most trading software nowadays offers a readily available feature for calculating EMA.
Difference between Exponential Moving Average and Simple Moving Average:
Now, you might be wondering which is superior between the Simple Moving Average and the Exponential Moving Average. Each has its strengths: EMA responds more swiftly to current market prices due to its emphasis on recent data points, whereas SMA treats all values equally. Despite their differences, both averages are interpreted similarly and are widely employed by technical traders to mitigate price fluctuations.
- EMAs react faster to price changes, while SMAs provide smoother trend direction.
- Traders favor EMAs for scalping and intraday trading due to their responsiveness. SMAs, on the other hand, suit positional trading, swing trading, and long-term investing, often combined with fundamental analysis.
How to use the Moving Average?
Moving averages excel at revealing trends, which can inform buying and selling decisions. Moving averages can be a helpful tool for identifying trends (Uptrend, Downtrend, Sideways) potential Support and Resistance levels, and Trend Reversal.
Let’s look at some general settings for popular trading methods.
1. 200 day moving average(Simple) /100 day Moving average(Simple) : Long-Term Trading and Positional Trading
2. 50 day Moving Average(Simple) : Swing Trading
3. 20 day Moving Average(Exponential) : Intraday Trading
4. 9 day Moving Average(Exponential) : Scalping
Having grasped the concept of moving averages, let’s dive into practical application! We’ll explore how to use them on real-time charts.
BUY- A stock price trading above its moving average (average price) can indicate buying pressure and potential bullish sentiment.
SELL- A stock price trading below its moving average (average price) can suggest selling pressure and potentially bearish sentiment.
Let’s proceed to examine a real-time example on the chart
1. 200 day moving average: Long-Term Trading
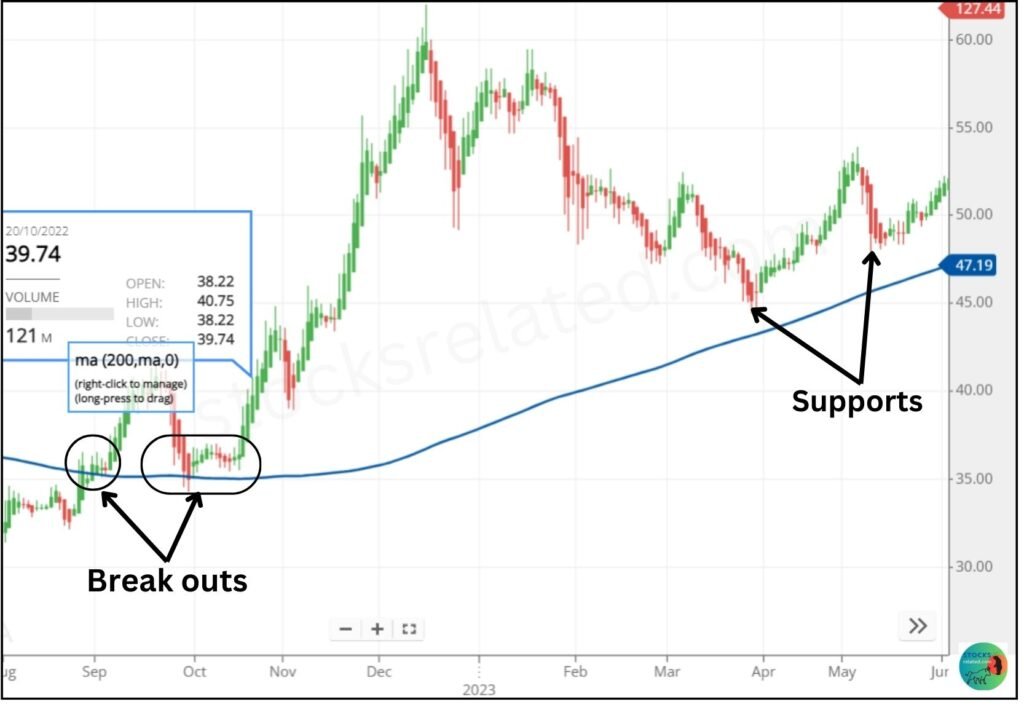
The above image is of PNB Stock: Simple – 200 day Moving Average and Candle time frame: 1 Day
Imagine that after identifying breakouts, we consistently observe the PNB stock forming consecutive Follow-Up Green candles for nearly 3-4 days following the 2nd breakout. In such a scenario, anyone considering entry would have ample reason to do so.
From the Chart Let’s assume,
Entry: 20 Oct 2022 – at 40 Rs
Holding Time: – 1 year
Exit: 3 Oct 2023 – at 83 Rs
Profit ~ 40 Rs (100%)
Great !!! Right? If you’ve been diligently following the trailing stop-loss and verified that the 200 day moving average is trending upwards, you’ll notice that today, March 12, 2024, the price stands at Rs 126.
2. 50 day moving average: Swing Trading
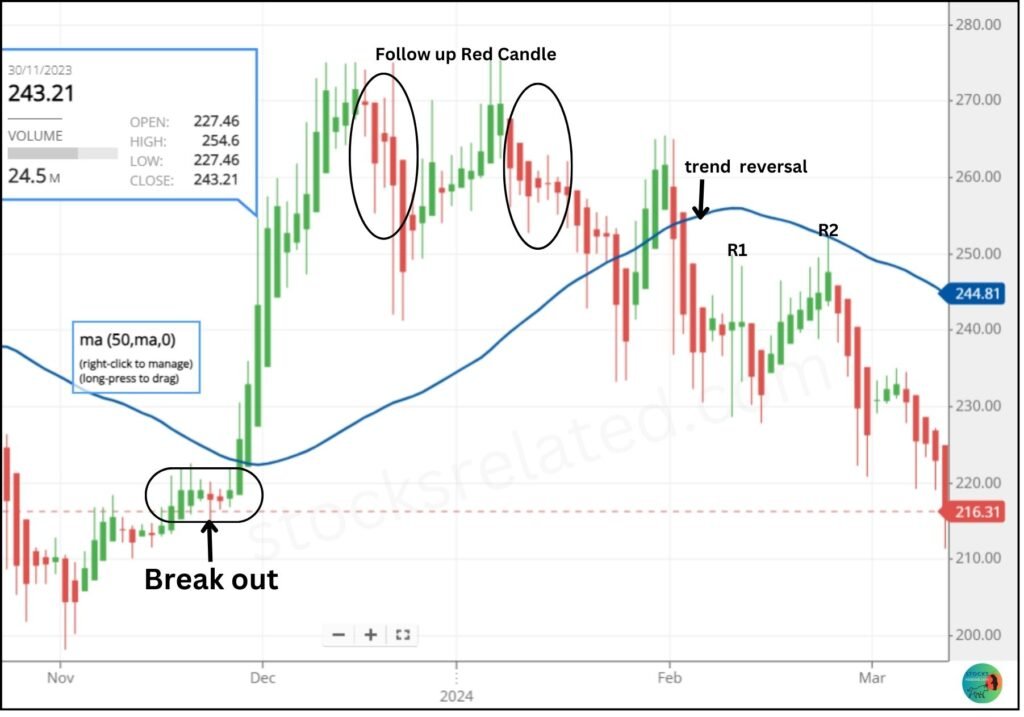
The above photograph is of INDIACEM Stock and the setting in the chart is Simple Moving Average – 50 day Moving Average and Candle time frame: 1 Day
The 50 day moving average chart above vividly displays breakout and exit points. Notably, within a month, we observe a significant red candle marking a potential two exit points. Additionally, the chart illustrates instances of trend reversal, followed by two tests of the resistance point.
Assume here after confirmation of Breakouts
Entry: 30 Nov 2023 – at 233.5 Rs
Holding Time: – 1 month
Exit: 4 Jan 2024 – at 277 Rs
Profit ~ 42 Rs (18%)
3. 9 day moving average: Scalping
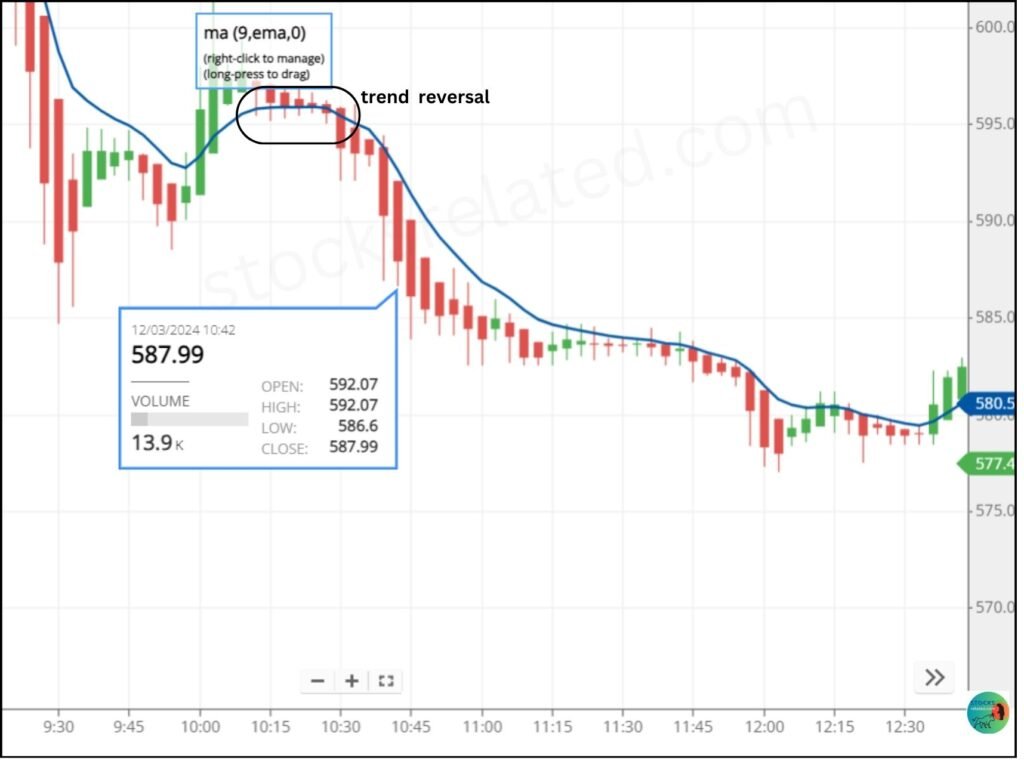
The above picture is of ASTRA MICRO Stock: Exponential – 9 day Moving Average and Candle time frame: 3 minute
The 9-day moving average chart is tailored for scalping trading purposes. In the chart provided above, when a trend reversal occurs around 10 a.m., and subsequent follow-up red candles emerge, it signals a potential opportunity for short selling, following confirmation.
Let us check again,
Entry: 10:42 am – at 590.5 Rs
Holding Time: – 15 minutes
Exit: 11:00 am – at 582.5 Rs
Profit ~ 8 Rs (1.4%)

Pingback: Scalping Trading Strategy: All time Winning Strategy
I have read some excellent stuff here. Definitely value bookmarking for revisiting. I wonder how much effort you put to make the sort of excellent informative website.